Data visualisation and storytelling for crypto investment
Designed an identity and assets for a Broadridge campaign
Sector
Discipline
Client
Broadridge: The Digital Asset Revolution
Relevant links
Year
2022
Vast numbers of reports are created by financial insight firms every day and so inboxes are full with subject lines promising unique intel, a new angle on a subject or large volumes of data to interrogate. In all this noise, how do you get your clients to read what is pertinent? How do you elevate your insight, putting it front and centre into the eyes of your desired audience? This is where great data visualisation and storytelling comes in.
Planning the story
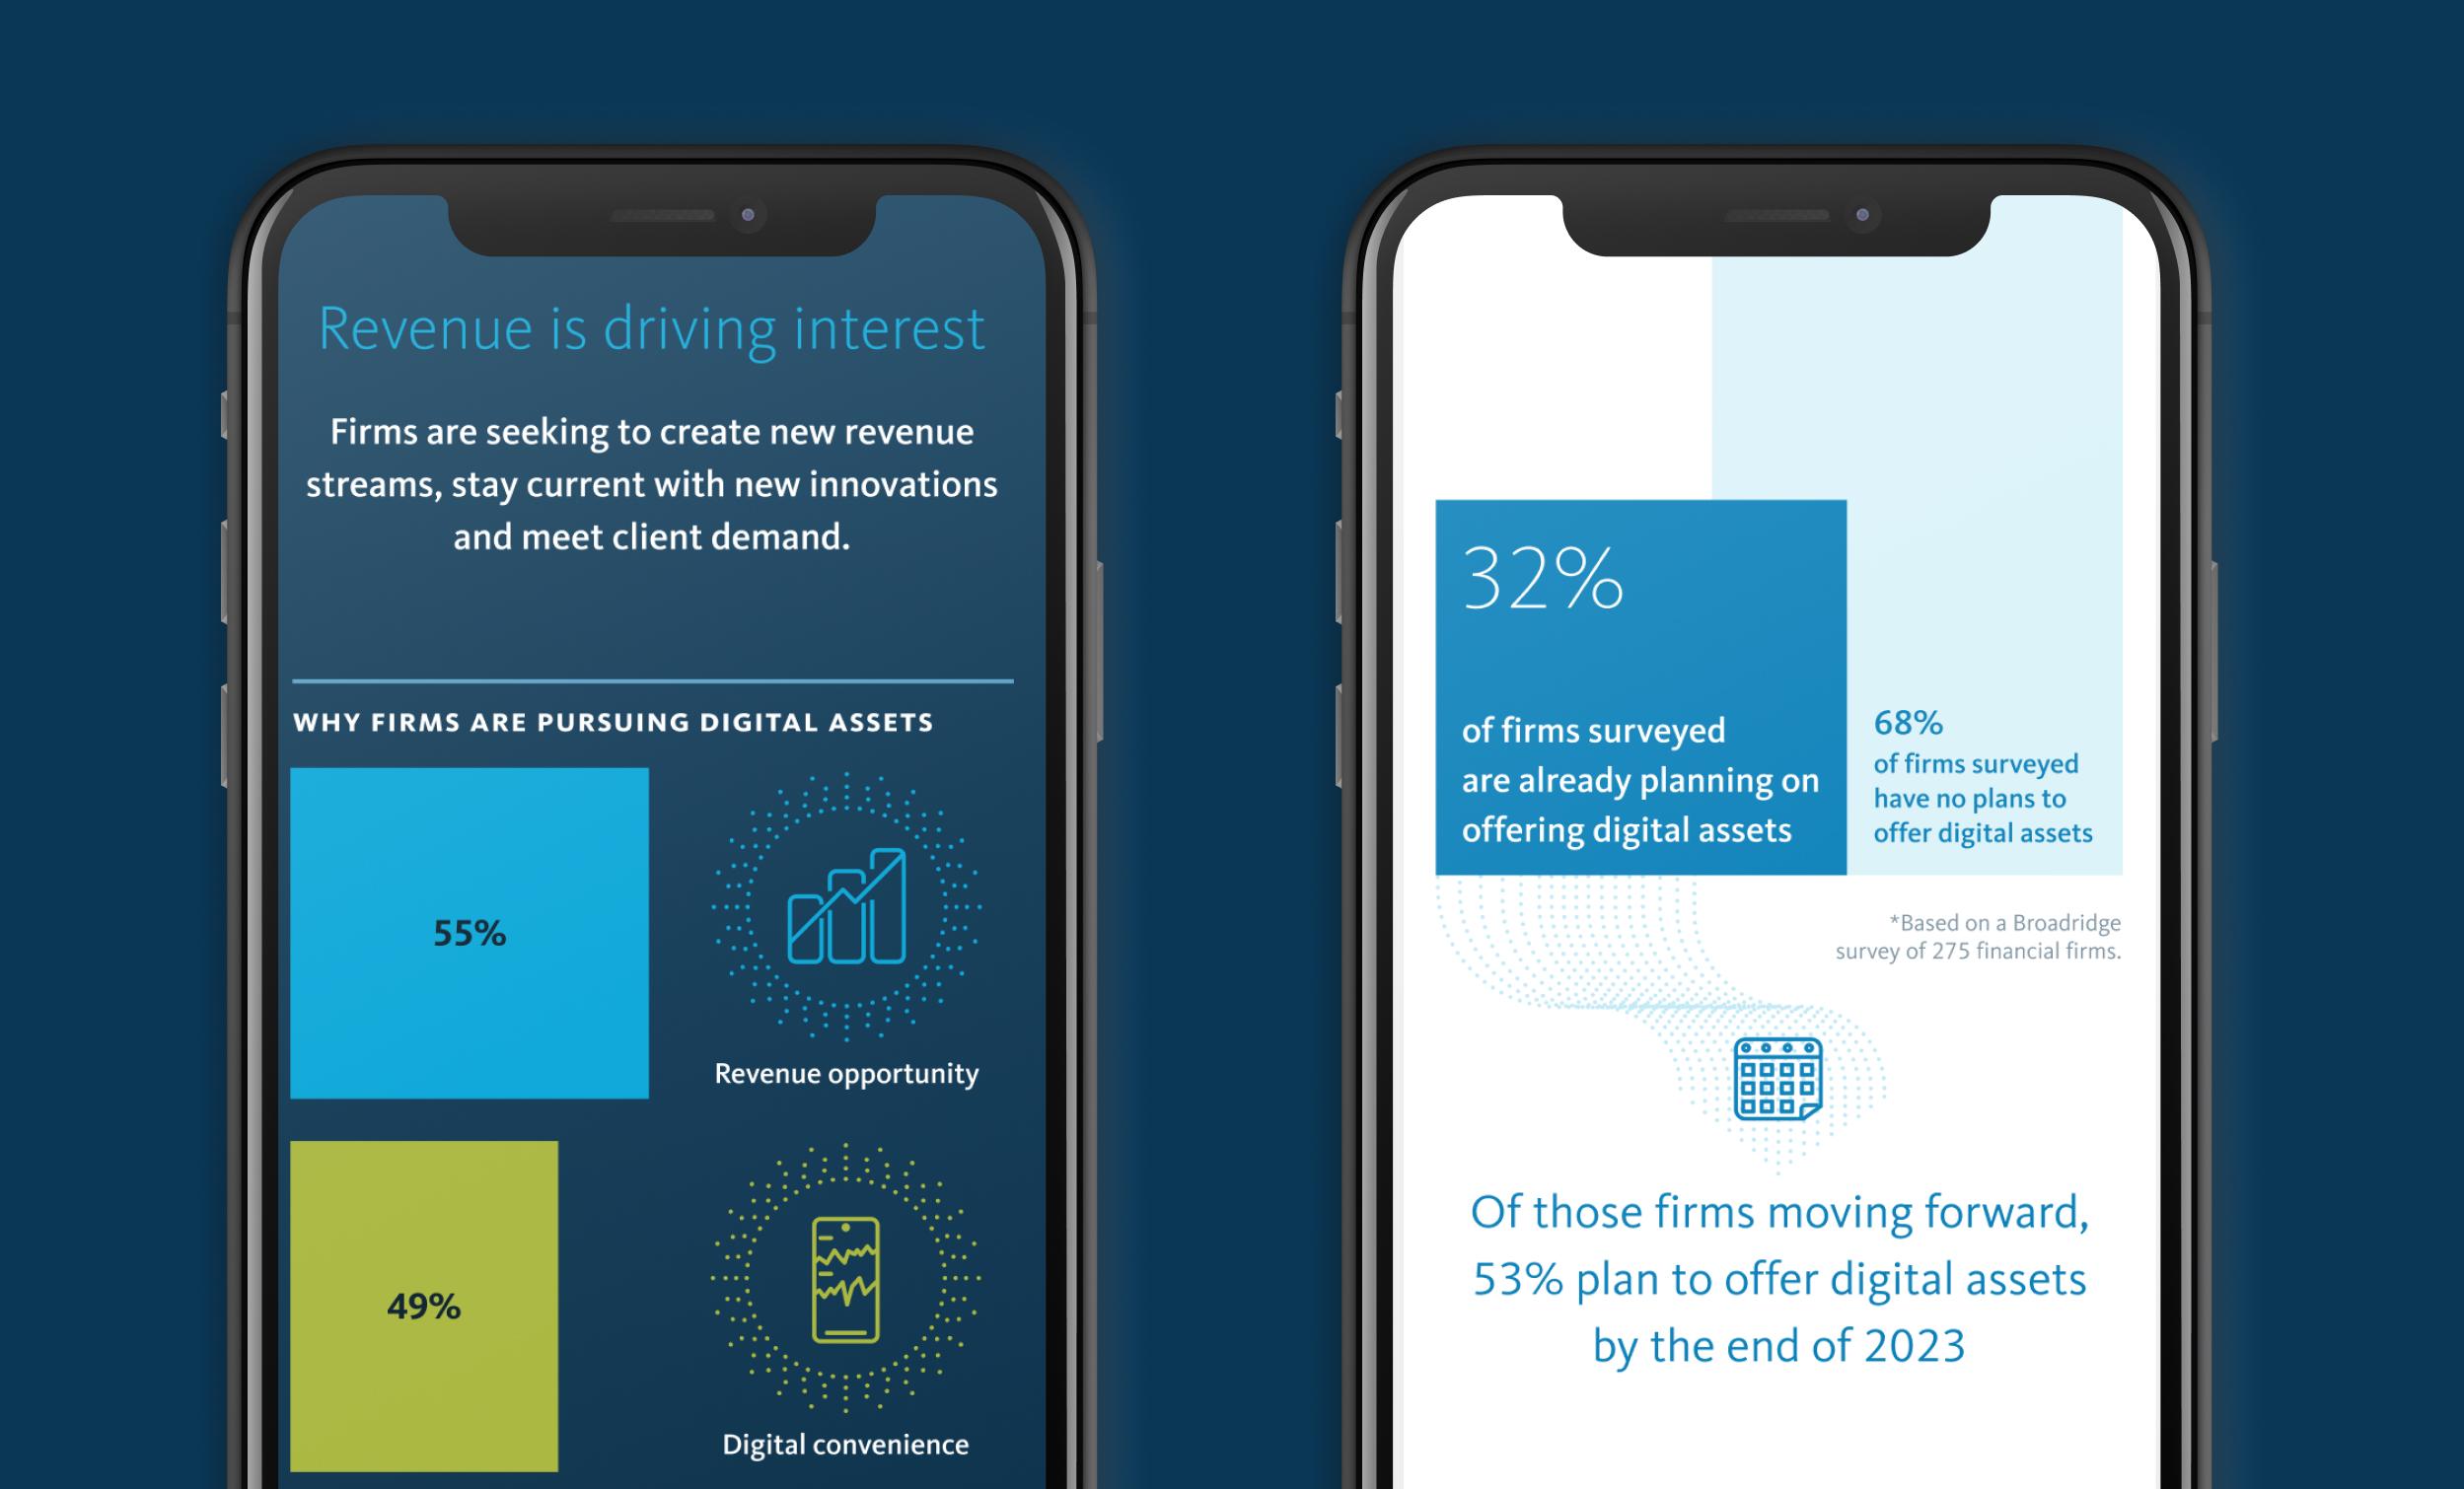
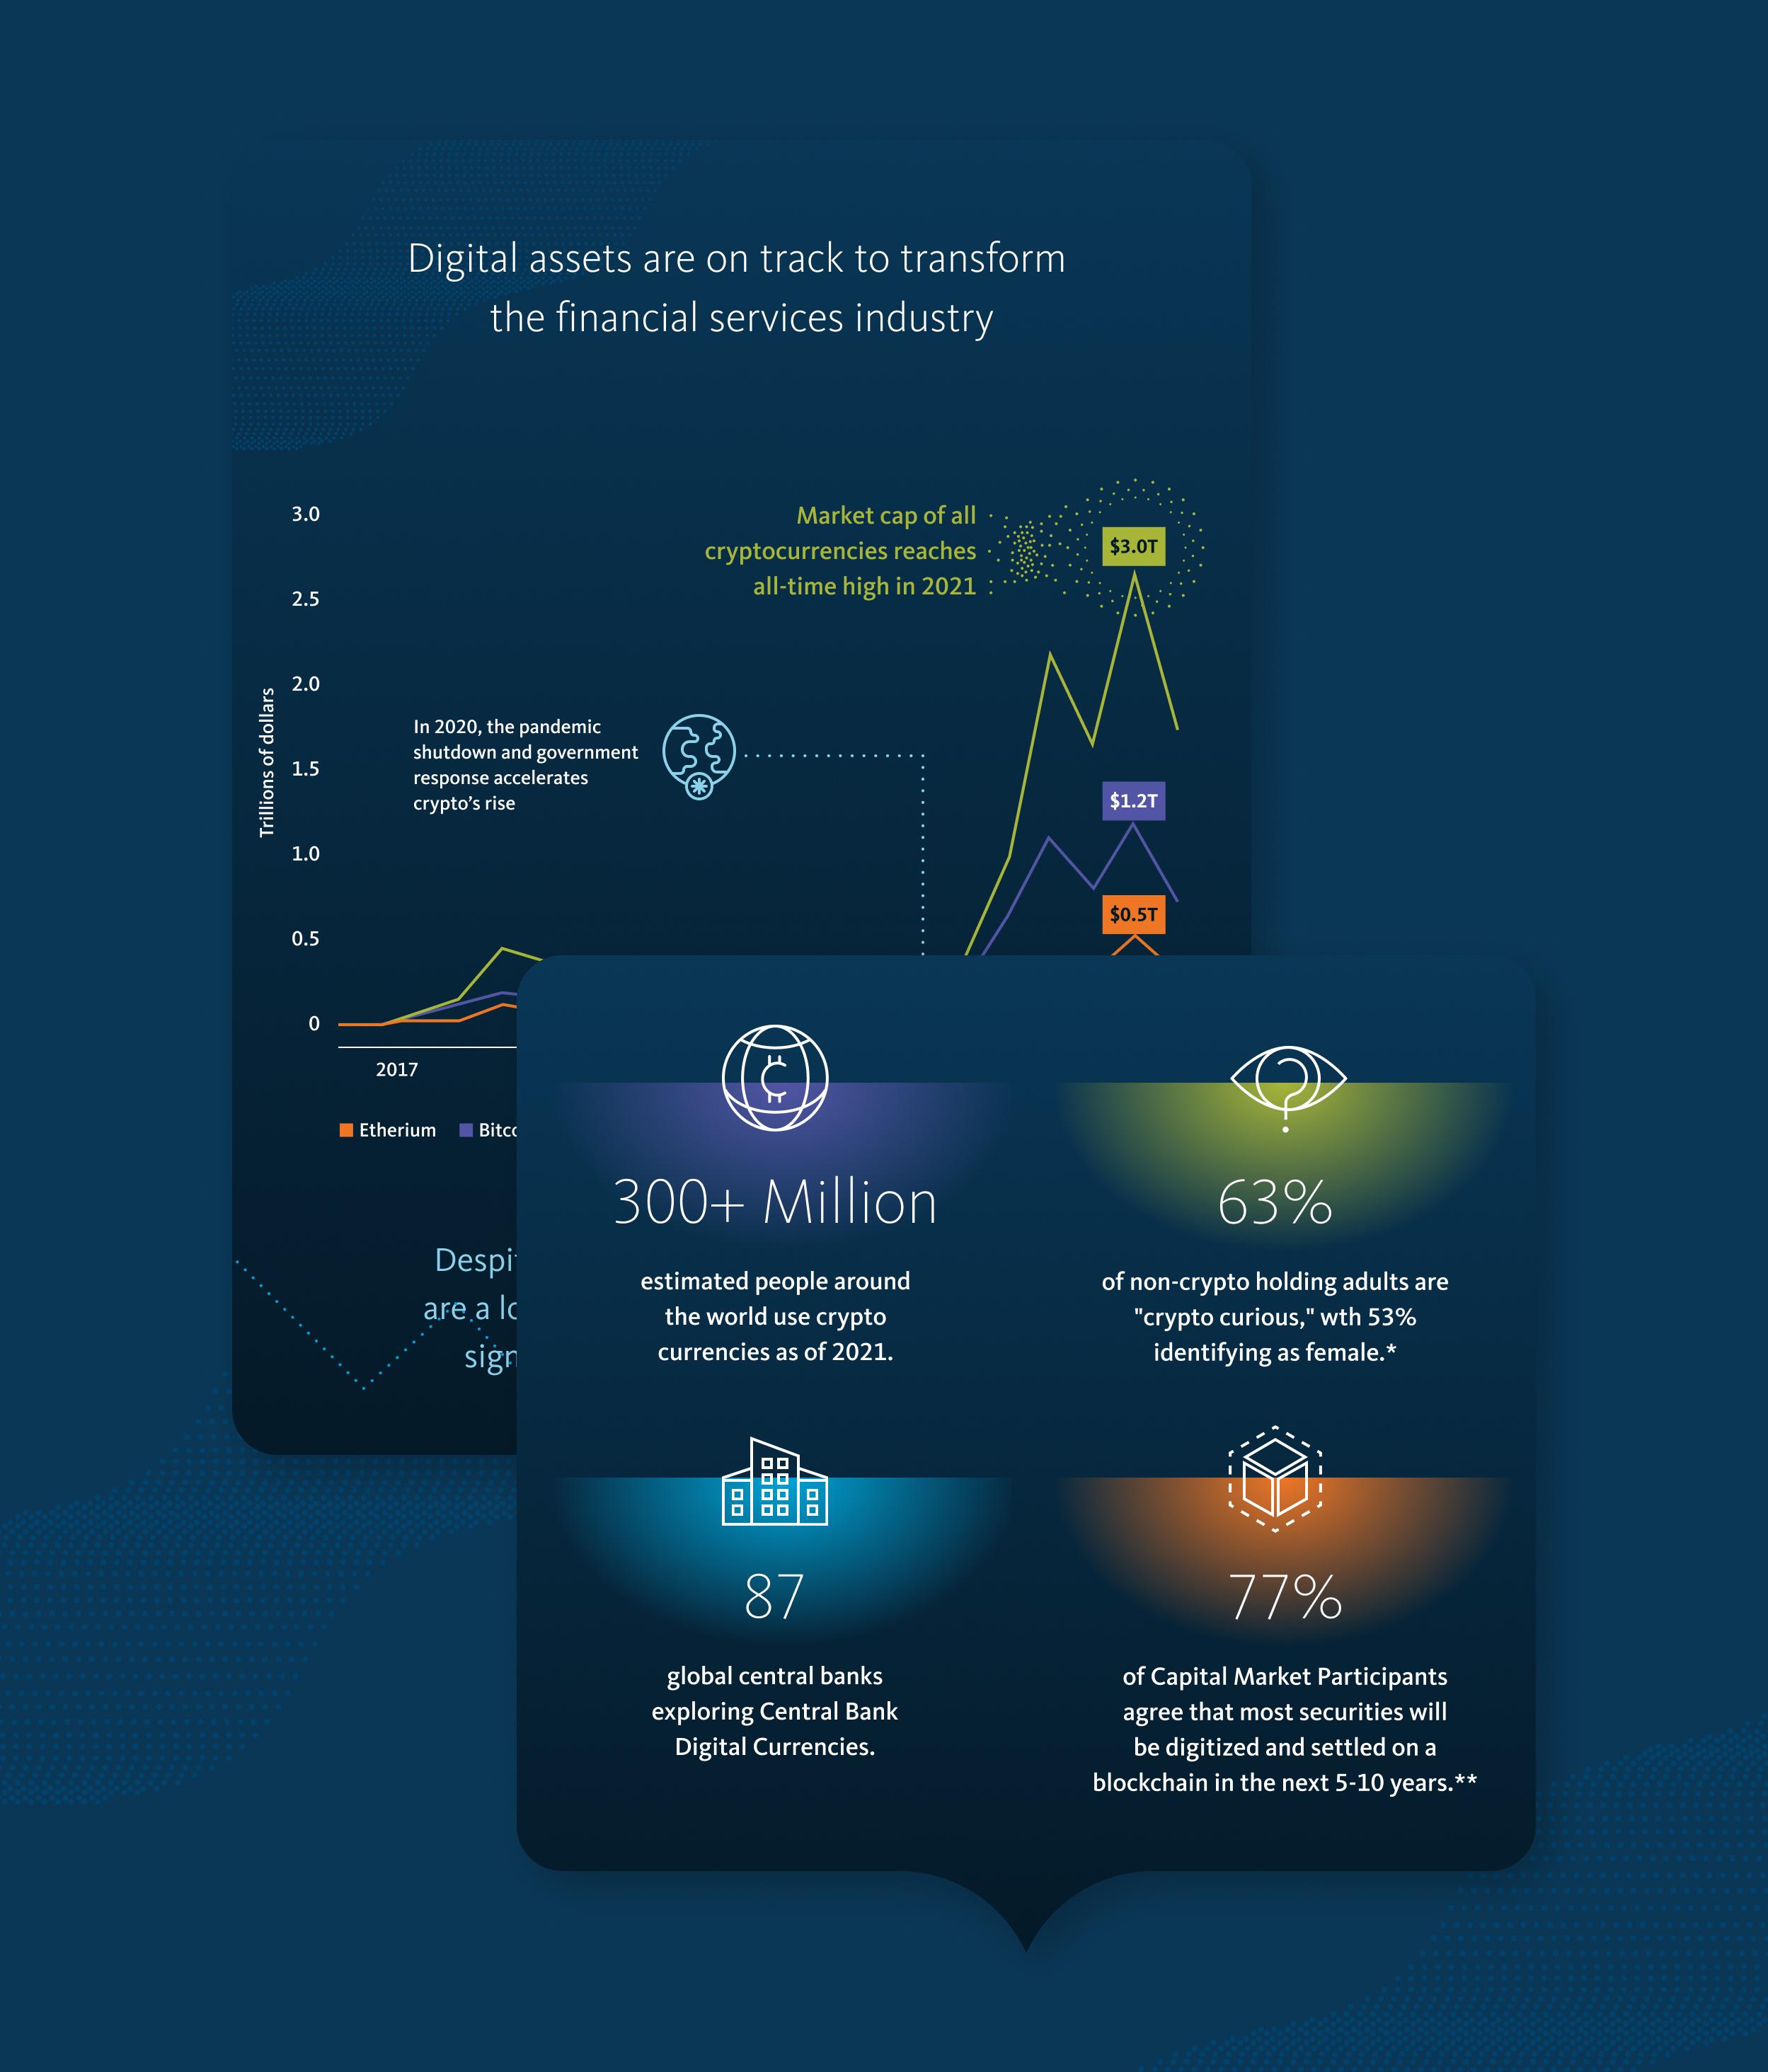
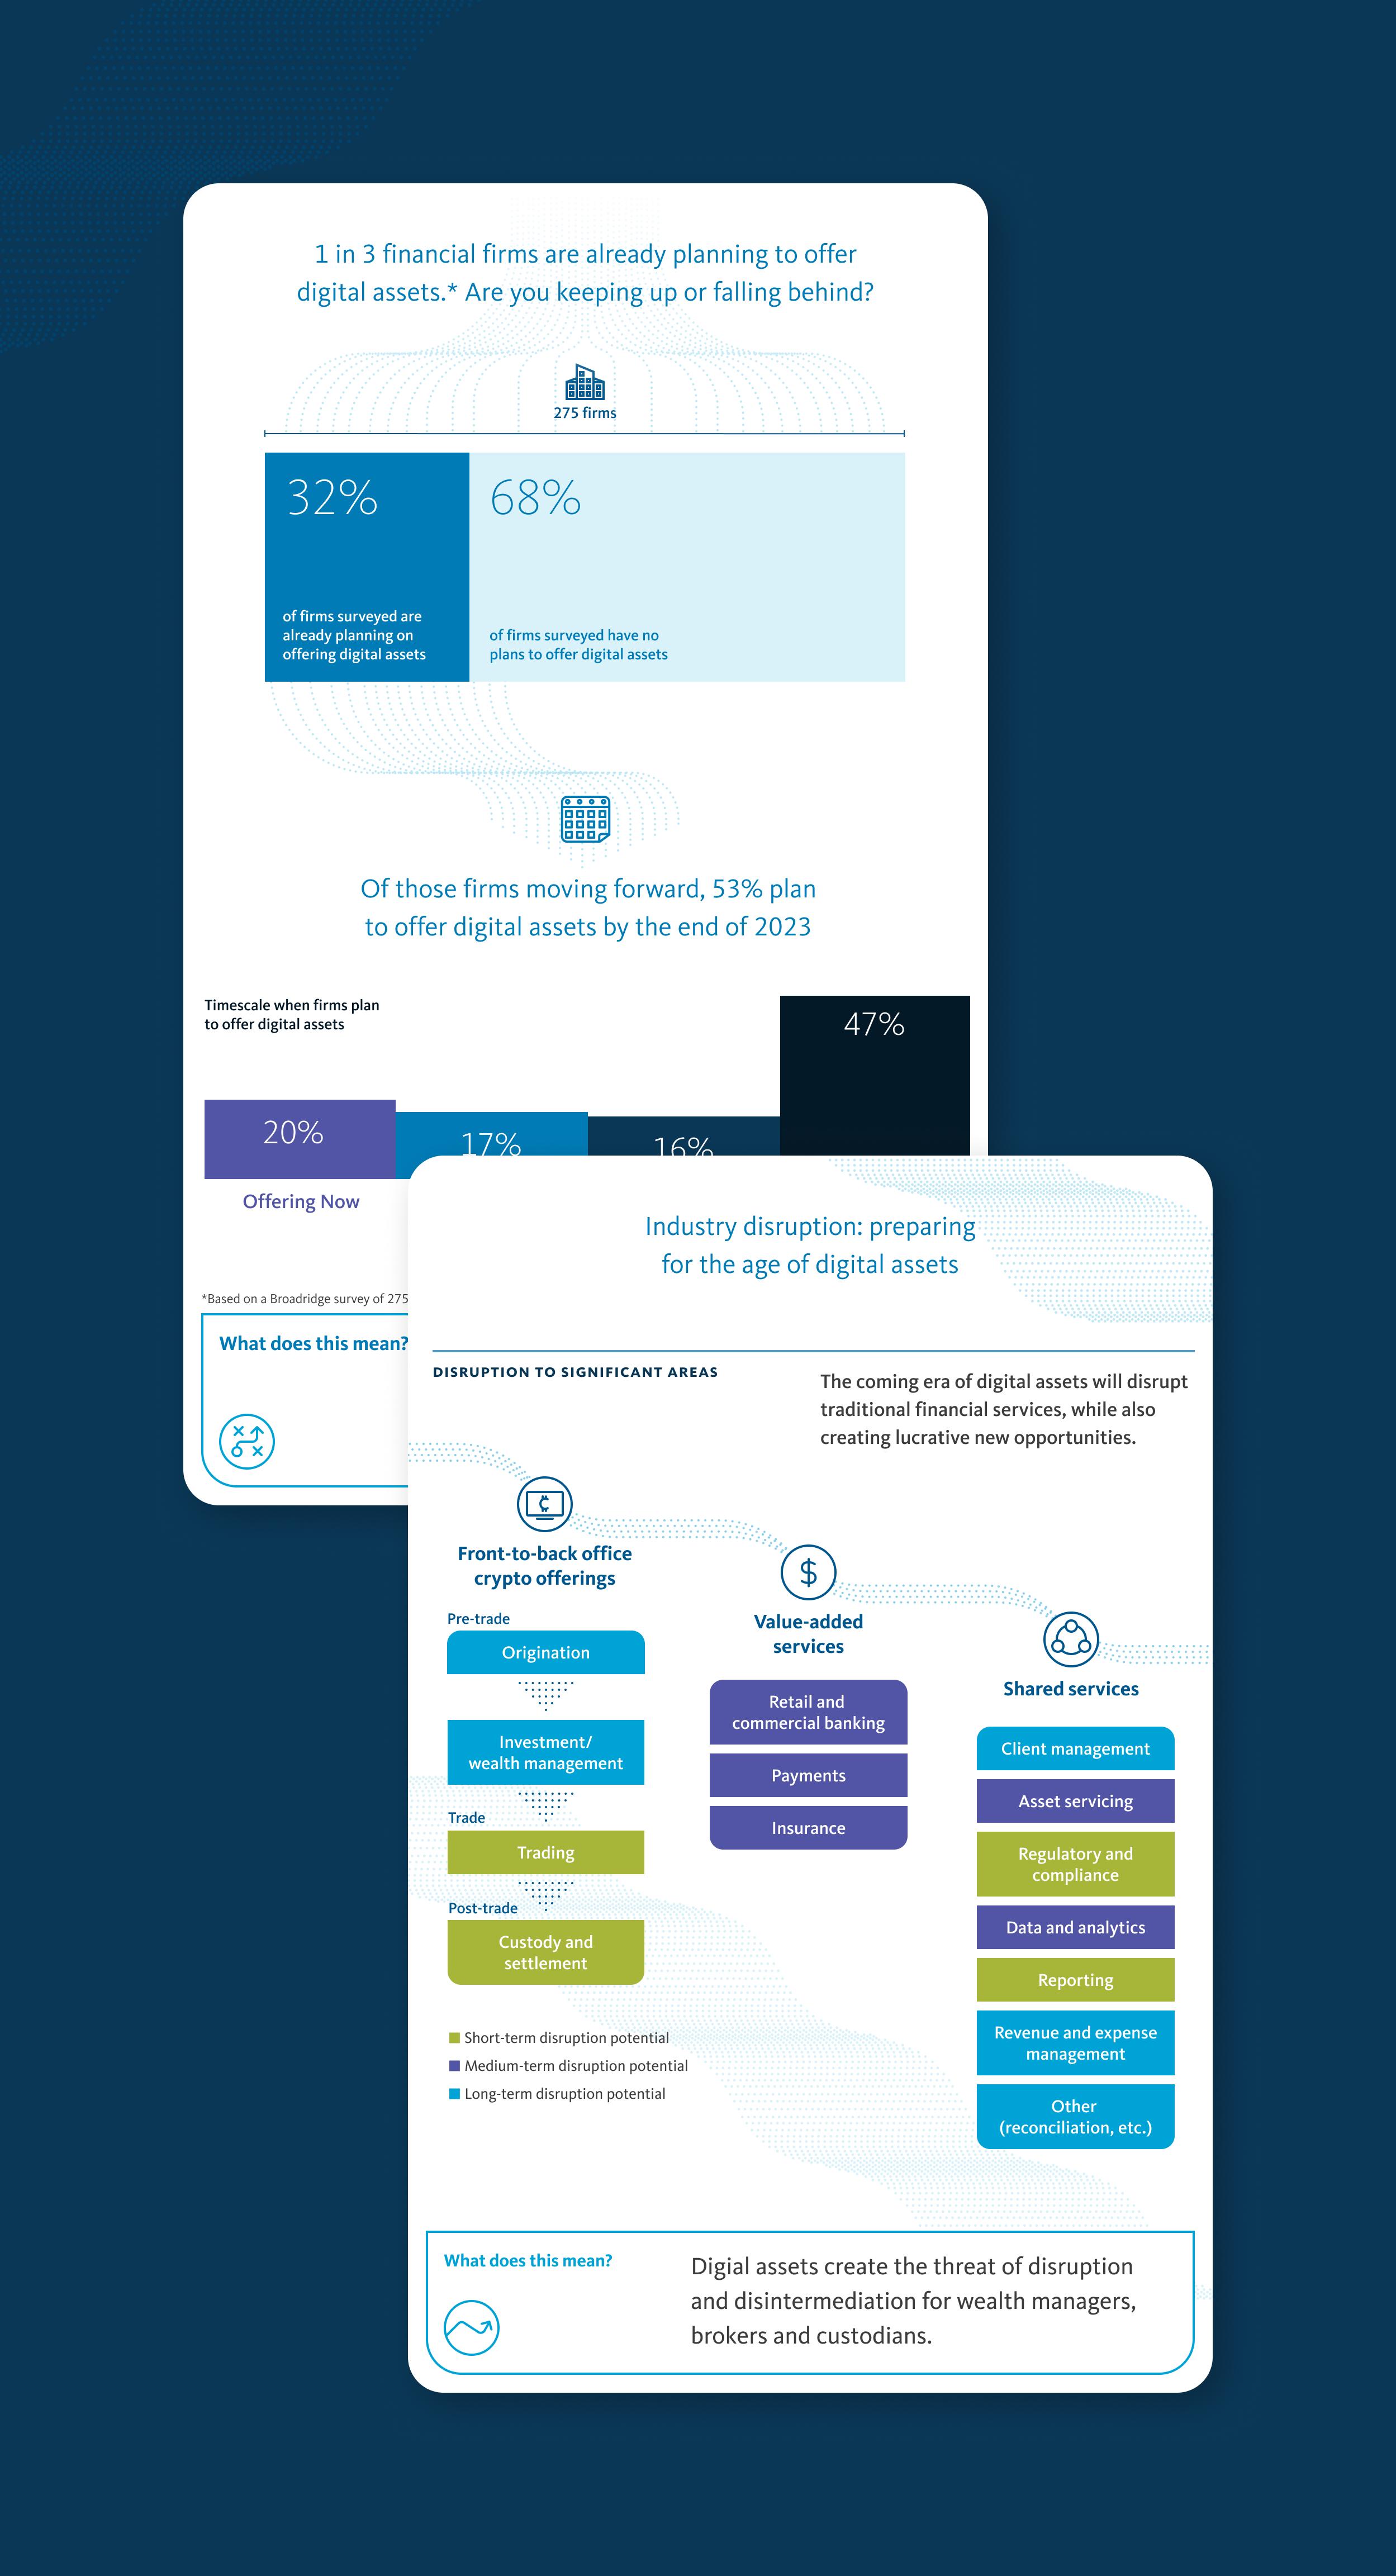
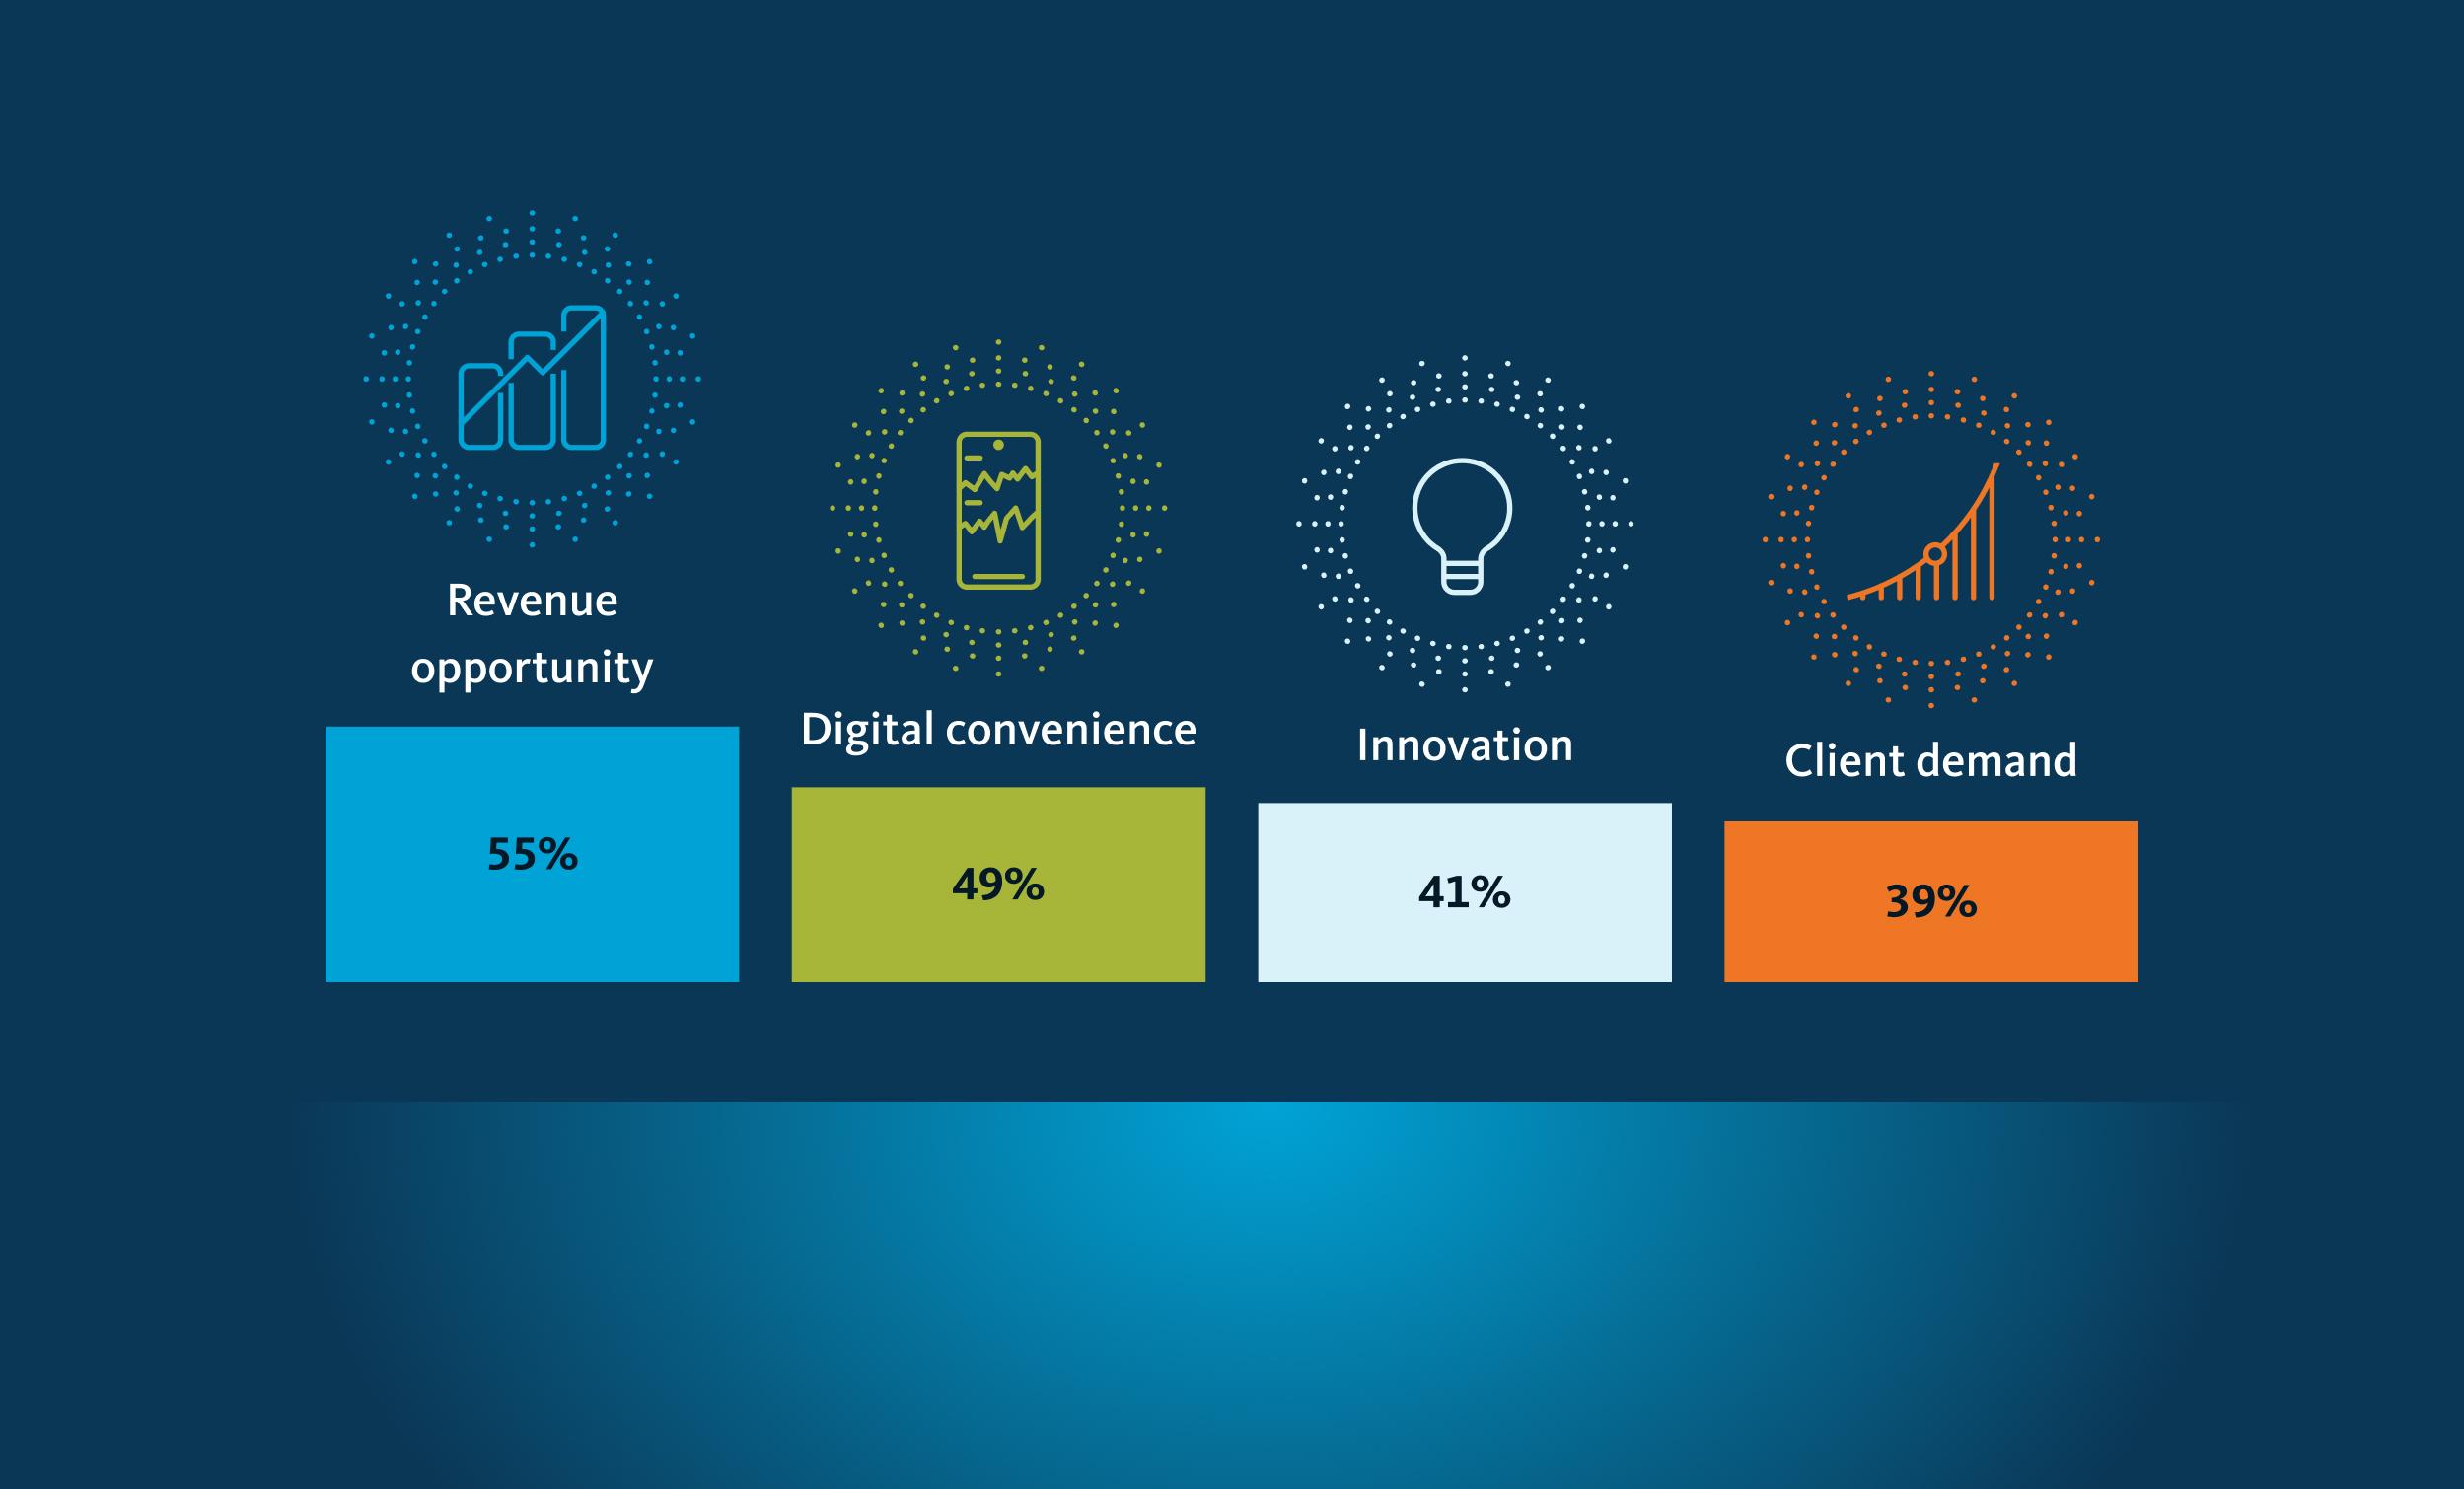
Broadridge approached our team to create a digital infographic that would tell the major story in their new report The Digital Asset Revolution: Preparing for the Next Generation of Financial Markets. We worked with their editorial team to determine which elements would be of most value to their readers and which data points we could showcase, putting together a script of what this infographic would look like including charts, icons and wider content blocks.
Social content and video
Our creative approach was applied to social content and video, used to drive traffic and interest to landing pages on the core Broadridge website.
Campaign look and feel
With the story defined, we then created a visual language that sat within the Broadridge brand but also brought something new and exciting to this campaign, referencing the topic. We used the Broadridge colour palette, adding bright accent colours to reflect the digital nature of cryptocurrency and crafting an ownable campaign style.
Delivery
Working with the Broadridge digital team we supplied assets to populate the campaign destination within their given digital template. We also produced a downloadable pdf that could be shared via email to form part of the wider report promotion.